CellTiter-Glo® 3D Cell Viability Assay

A Cell Viability Assay Validated for 3D Microtissue Cultures
- Formulated specifically for 3D cell culture models, where standard viability assays underperform due to incomplete lysis
- Simple 30-minute protocol with a single ready-to-use reagent
- Excellent assay precision, suitable for high-throughput 3D drug screening
Catalog Number:
Size
Catalog Number: G9681
Catalog Number: G9682
Catalog Number: G9683
What Is the CellTiter-Glo® 3D Cell Viability Assay and How Does It Work?
The CellTiter-Glo® 3D Assay is a homogeneous, luminescent cell viability assay designed specifically for three-dimensional cell culture models, including tumor spheroids, organoids, and cells embedded in extracellular matrix scaffolds such as Matrigel®. It quantifies adenosine triphosphate (ATP)—a direct indicator of metabolically active cells—using the same proven luciferase-based chemistry as the original CellTiter-Glo® assay, reformulated with an enhanced lysis buffer engineered to penetrate and disrupt the compact, multilayered structure of 3D cultures.
The assay uses a single ready-to-use reagent and delivers results in 30 minutes. The glow-type luminescent signal is stable for more than 5 hours, enabling flexible plate processing in high-throughput environments.
Discover how automated 3D culture workflows using the CellTiter-Glo® 3D Cell Viability Assay on the MO:BOT system delivers a robust solution for assessing 3D spheroid and organoid viability.
Case Study
Challenge:
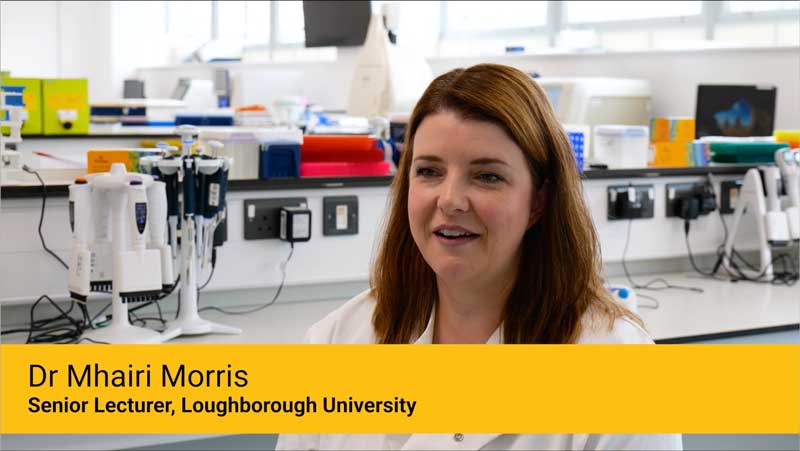
Dr. Mhairi Morris, Senior Lecturer at Loughborough University, studies the relationship between fat cells and cancer. She needed a less variable solution than MTT assays to model interactions between cells in a 3D environment.
Result:
Using the CellTiter-Glo® 3D Assay, she was able to transition from 2D to 3D models, giving a more accurate picture of how visceral fat and subcutaneous fat interact with cancer cells.
Because the 3D environment is more biologically relevant and the assay measures ATP released from viable cells, she's seeing less variability in her results. Additionally, the simple protocol means she's saving time and effort she can devote to her research.
How Much Better Is ATP Recovery in the CellTiter-Glo® 3D Assay vs. the Standard Assay?
Direct measurement of ATP recovery at four spheroid sizes demonstrates that the advantage of CellTiter-Glo® 3D Assay scales with spheroid diameter—the larger and more compact the spheroid, the greater the underestimation produced by the standard CellTiter-Glo® Assay.
| Spheroid Diameter(μm) | Standard CellTiter-Glo® Assay (pmol/microtissue) | CellTiter-Glo® 3D Assay (pmol/microtissue) | Recovery Ratio (3D:Standard) |
|---|---|---|---|
| 188 | 16 ± 4 | 17 ± 4 | 1.10 |
| 386 | 79 ± 3 | 94 ± 11 | 1.19 |
| 459 | 103 ± 2 | 126 ± 11 | 1.22 |
| 565 | 127 ± 3 | 178 ± 17 | 1.40 |
How Sensitive Is the CellTiter-Glo® 3D Assay Compared to Other Viability Assays?
The CellTiter-Glo® 3D Assay produces luminescent signals that are orders of magnitude above background in 3D microtissue models—a substantially larger signal-to-noise margin than either fluorometric or colorimetric alternatives. In direct comparison using InSphero Insight™ human liver microtissues (~250μm diameter), alamarBlue® and MTT generated signals only modestly above their no-cell controls, while the CellTiter-Glo® 3D Assay produced a robust, high-contrast readout. The CellTiter-Glo® 3D Assay also completed the assay in 30 minutes, compared to 3 hours for alamarBlue® and 8 hours for MTT.
| Assay | Detection Method | Total Assay Time | Signal vs. No-Cell Background |
|---|---|---|---|
| CellTiter-Glo® 3D | ATP luminescence (luciferase reaction) | 30 minutes | Orders of magnitude above background |
| alamarBlue®/resazurin | Fluorescence (redox reduction) | 3 hours | Modestly above background |
| MTT | Absorbance (colorimetric) | 8 hours | Modestly above background |
Comparison data: InSphero Insight™ human liver microtissues (~250μm); HCT116 colon cancer cells seeded into an InSphero GravityPLUS™ 96-well hanging-drop platform and grown to generate ~340μm spheroids.All microtissues assayed per manufacturer protocols.
The superior sensitivity of ATP-based luminescence over colorimetric or fluorometric methods in 3D models reflects two compounding advantages: the luciferase-based assay detects ATP directly with high signal amplification, and CellTiter-Glo® 3D’s enhanced lysis buffer ensures complete ATP recovery from throughout the spheroid. Fluorometric assays like alamarBlue® depend on metabolic reduction rates that are lower in the hypoxic and nutrient-limited interior of 3D spheroids, further reducing their signal in the models where accurate measurement matters most.
How Does the CellTiter-Glo® 3D Assay Compare to Other Lytic Assays that Measure ATP?
Improved 3D Microtissue Penetration, More Accurate Viability Data
HCT116 colon cancer spheroids were generated by seeding cells in the InSphero GravityPLUS™ 96-well hanging-drop platform and grown for 4 days.
Panel A. An equivalent volume of reagent was added to all samples, and after 5 minutes of shaking, luminescence was recorded at 30 minutes.
Panel B. A 2X concentration of CellTox™ Green Dye was added to CellTiter-Glo® 3D Reagent (left) or ATPlite™ 1Step Reagent (right) prior to sample addition as an indicator of cell lysis and images were acquired at 30 minutes. The spheroids in Panel B are ~300μm in diameter, and the bars in each image represent a distance of 200μm.

Is the CellTiter-Glo® 3D Assay Suitable for High-Throughput Drug Screening?
Yes. The CellTiter-Glo® 3D Assay has been validated for use in high-throughput 3D drug screening with demonstrated assay precision meeting HTS quality thresholds.
Z′-Factor Performance in 3D Spheroids
Four hundred HCT116 colon cancer cells were seeded into each of 60 wells of a 96-well InSphero GravityPLUS™ hanging-drop plate and incubated for 4 days to form 60 spheroids (~350μm in diameter). Half of the spheroids were treated with 100μM panobinostat (gray squares), and the other half were treated with vehicle (1% DMSO, orange squares). After 48 hours, all samples were assayed with the CellTiter-Glo® 3D Reagent. The CellTiter-Glo® 3D Assay provided a Z´-factor of 0.81.

What 3D Culture Formats Are Compatible?
The CellTiter-Glo® 3D Assay has been validated across three widely used 3D culture formats, delivering equivalent dose-response results in all three formats. The results of compound screening in hanging-drop, ultra-low attachment plate (ULA) and Matrigel® 3D cultures are shown below.


HCT116 colon cancer cells were seeded as follows: 400 cells in hanging-drop; 1,000 cells in ULA or Matrigel®. Microtissues were grown for 4 days, treated with compounds for 48 hours, and then assayed with the CellTiter-Glo® 3D Reagent. Luminescence was recorded at 30 minutes.
Tools to Monitor Biology in 3D Culture
When working with 3D culture models, choosing the right assay system is crucial. Learn about tools to monitor biology in 3D culture.
Protocols
Complete Protocol
Quick Protocols
Frequently Asked Questions
How does the CellTiter-Glo® 3D Assay differ from the standard CellTiter-Glo® Assays?
The table below summarizes the key differences between the standard CellTiter-Glo® Assays (for 2D monolayers) and the CellTiter-Glo® 3D Assay, incorporating validated performance data from Promega internal studies.
| Factor | Standard CellTiter-Glo® Assays (2D) | CellTiter-Glo® 3D Assay |
|---|---|---|
| Culture model | Monolayer (adherent or suspension) | Spheroids, organoids, 3D matrix cultures |
| Reagent format | Two-component (original) or ready-to-use (2.0) | Single ready-to-use reagent with enhanced lysis buffer |
| Lysis mechanism | Standard detergent lysis; effective for monolayers | Enhanced lysis buffer validated to penetrate dense 3D structures |
| ATP recovery (large spheroids) | Underestimates | Higher recovery |
| Incubation time | 10 minutes | 30 minutes |
| Sensitivity | Highly sensitive luminescent readout | Highly sensitive luminescent readout |
| 3D culture format compatibility | Not validated for 3D | Validated: hanging-drop, ULA plates, Matrigel®—equivalent results across all three |
| HTS compatibility | Yes—96/384/1536-well formats | Yes—validated in 96- and 384-well ULA formats |
What are the most common methods for measuring cell viability in 3D cultures?
Several assay platforms can be adapted for 3D viability measurement, each with distinct trade-offs between sensitivity, throughput, spatial resolution and assay time. CellTiter-Glo® 3D Assay performance data are included for direct comparison.
| Method | Principle | Key Strengths | Key Limitations |
|---|---|---|---|
| ATP luminescence (CellTiter-Glo® 3D) | Quantifies intracellular ATP via luciferase after enhanced lysis | Highest sensitivity; 30-minute protocol; Z′ = 0.81 in 3D HTS; HTS-compatible | Endpoint/destructive; no spatial information |
| Live/dead fluorescence (Calcein-AM/EthD-1) | Membrane-permeable dye stains live; exclusion dye stains dead cells | Spatial viability map; nondestructive option | Requires imaging; depth-of-field limits in large spheroids |
| Metabolic/colorimetric (MTT, alamarBlue®) | Metabolic reduction to colored/fluorescent product | Nondestructive (resazurin); low cost | 3- to 8-hour assay time; signal only modestly above background in 3D; poor penetration in compact spheroids |
| Flow cytometry | Single-cell analysis after spheroid dissociation | High resolution; multi-parameter | Requires dissociation; loses spatial context; low throughput |
| Confocal/light sheet imaging | 3D spatial fluorescence microscopy | Full 3D spatial and temporal viability data | High equipment cost; complex analysis; slow throughput |
Can I use standard CellTiter-Glo® Assay or CellTiter-Glo® 2.0 for 3D cell cultures?
The standard CellTiter-Glo® Assays are not recommended for compact 3D spheroids due to incomplete lysis. Use the CellTiter-Glo® 3D Cell Viability Assay because it is specifically optimized for 3D models.
How sensitive is the CellTiter-Glo® 3D Assay compared to other viability assays?
ILike other luminescent assays, the CellTiter Glo® 3D Assay has very low background, so it typically produces optimized signal to background ratios in the tens to thousands range. In comparison, fluorescence- or absorbance-based viability assays often generate signals only a few fold above background.
What is the Z′-factor for CellTiter-Glo® 3D Assay in high-throughput 3D screening?
The CellTiter-Glo® 3D Assay achieved a Z′-factor of 0.81 in a 96-well 3D precision experiment using HCT116 colon cancer spheroids (~350μm diameter). Thirty spheroids were treated with 100μM panobinostat (positive control) and 30 with vehicle (negative control). A Z′-factor above 0.5 is the accepted HTS threshold; 0.81 indicates excellent assay window separation, confirming suitability for high-throughput 3D drug screening.
Which 3D culture formats are compatible with CellTiter-Glo® 3D?
CellTiter-Glo® 3D Assay has been validated across three major 3D culture formats with equivalent dose-response results in all three: hanging-drop cultures (InSphero GravityPLUS™ platform), ultra-low attachment (ULA) round-bottom plates, and Matrigel® 3D cultures. All formats used HCT116 colon cancer cells grown for 4 days and treated with compounds for 48 hours before assay.
Are there protocol differences between CellTiter-Glo® 3D Assay and the standard assay?
Yes—three modifications are required for 3D cultures: (1) add reagent at 1:1 volume ratio with culture medium (same as standard), but mix more vigorously for 5 minutes rather than 2 minutes; (2) incubate for 25–60 minutes rather than 10 minutes to allow the enhanced lysis buffer time to fully penetrate the 3D structure; (3) equilibrate both the plate and reagent to room temperature for 30 minutes before addition. Total assay time from reagent addition to read is 30 minutes for standard spheroid sizes.
What alternatives exist to CellTiter-Glo® 3D Assay for 3D viability measurement?
Alternatives include: fluorescent live/dead staining (e.g., Calcein-AM/EthD-1) for spatial viability maps requiring imaging; resazurin-based assays (alamarBlue®) as nondestructive options with lower sensitivity in 3D and a 3-hour protocol; and ATPlite™ 1Step (PerkinElmer), which uses standard lysis chemistry that provides inferior penetration and ATP recovery compared to the CellTiter-Glo® 3D Assay in compact spheroids. For kinetic monitoring in 3D, the RealTime-Glo™ MT Assay is a non-lytic option that requires experimental validation in each 3D model.
How do CellTiter-Glo® 3D Assay results compare to 2D viability data for the same compound?
IC₅₀ values from 3D spheroids are typically higher than those from 2D monolayers for the same compound, reflecting the more physiologically relevant drug microenvironment in 3D. Quiescent cells in the spheroid interior are less susceptible to antiproliferative agents, and diffusion barriers limit drug penetration to inner cell layers. This makes 3D IC₅₀ values more predictive of in vivo activity, and the difference is a biologically meaningful feature rather than an assay artifact.
Why do drug responses differ between 2D and 3D models?
3D tumor spheroids replicate in vivo tumor microenvironments more closely than monolayers, including oxygen and nutrient gradients, cell-cell and cell-matrix interactions, and the emergence of hypoxic cores in larger spheroids. These biological features produce drug responses that often differ from 2D data: IC₅₀ values are typically higher (lower apparent potency) in 3D, and some compound classes that appear active in 2D show reduced activity in 3D when the target requires dividing cells or relies on efficient tissue penetration. This is considered a feature of 3D models—the data are more predictive of in vivo compound activity.
What plates and readout settings are recommended?
Solid white opaque plates are best for reading. Grow spheroids in clear U-bottom/low-attachment plates if needed, then transfer lysates to opaque solid white plates for reading. Use a luminometer with top-read and no emission filter to maximize signal and minimize cross-talk. Most standard luminescence settings are suitable and the signal is stable so you can test to find what gives you the best signal above the background
How do I optimize lysis and shaking for 3D cultures?
Ensure vigorous but spill-free shaking (start around 450 rpm) and extend mixing/incubation until signal plateaus. For large or dense 3D samples, perform ATP recovery experiments as described in Technical Manual #TM412.
Can the CellTiter-Glo® 3D Assay be used with tissues or non-3D samples (pellets, suspensions, tissue material)?
This assay can be used with cell pellets and suspension cells. Researchers outside of Promega have tried it on small tissue pieces, but these applications are not fully validated. Large spheroids, tissues and collagen or other complex matrices require case-by-case optimization and may not be suitable. Perform ATP recovery experiments as described in Technical Manual #TM412.
What are the limitations of the CellTiter-Glo® 3D Assay?
Understanding these limitations supports appropriate experimental design:
- The reagent penetration and ATP recovery decrease as microtissues become large, but for small to moderate size spheroids (~350µm or less), penetration and recovery are excellent. Very large or highly compact spheroids (>350μm) may require extended incubation and additional vortexing.
- Endpoint/destructive—cell lysis prevents kinetic monitoring. For continuous real-time viability in 3D, the RealTime-Glo® MT Assay requires separate validation for each 3D model.
- No spatial viability information—the assay reports total viable ATP from the full spheroid but cannot reveal necrotic core vs. viable rim distribution. Complement with live/dead fluorescence imaging when spatial context is needed for mechanistic interpretation.
- Matrix interference—Matrigel® and other hydrogel matrices may impede reagent penetration at high concentrations. Run matrix-only controls to characterize background ATP contribution and confirm equivalent lysis efficiency vs. non-matrix formats.
- Luciferase inhibitor compounds—some library compounds directly inhibit luciferase activity, generating false-positive cytotoxicity signals. Screen at the highest tested concentration with a luciferase counter-assay or ATP spike if compound interference is suspected.
Specifications
Catalog Number:
What's in the box?
| Item | Part # | Size |
|---|---|---|
CellTiter-Glo® 3D Reagent |
G968A | 1 × 10ml |
SDS
Search for SDSCertificate of Analysis
Use Restrictions
For Research Use Only. Not for Use in Diagnostic Procedures.Storage Conditions
What's in the box?
| Item | Part # | Size |
|---|---|---|
CellTiter-Glo® 3D Reagent |
G968A | 10 × 10ml |
SDS
Search for SDSCertificate of Analysis
Use Restrictions
For Research Use Only. Not for Use in Diagnostic Procedures.Storage Conditions
What's in the box?
| Item | Part # | Size |
|---|---|---|
CellTiter-Glo® 3D Reagent |
G968B | 1 × 100ml |
SDS
Search for SDSCertificate of Analysis
Use Restrictions
For Research Use Only. Not for Use in Diagnostic Procedures.Storage Conditions
Related Products
Similar Products
CellTiter-Glo® 2.0 Cell Viability Assay
Updated CellTiter-Glo® Cell Viability Assay with improved reagent stability. Quantifies cell proliferation based on ATP detection.
G9241, G9242, G9243
CellTox™ Green Cytotoxicity Assay
Measures changes in membrane integrity. Kinetically monitors cytotoxicity up to 72 hours with multiplex capability.
G8741, G8742, G8743, G8731
Caspase-Glo® 3/7 3D Assay
A simple luminescent assay that measures caspase-3 and -7 activities in 3D cultures.
G8981, G8982, G8983
GSH/GSSG-Glo™ Assay
Homogeneous assay to quantify total glutathione and glutathione ratios.
V6611, V6612
Resources
Articles
- Reproducible Drug Screening Assays Using Single Organoids
- Verifying Cell-Based Assays for Use with 3D Models
- Luminescent Viability Assays for Magnetically Bioprinted Hepatocyte Spheroids
- App Note: Predicting gastrointestinal toxicity
- Enhanced extrinsic apoptosis of therapy-induced senescent cancer cells using a death receptor 5 (DR5) selective agonist
- Lipidomics profiling reveals differential alterations after FAS inhibition in 3D colon cancer cell culture models
- ALDOC- and ENO2- driven glucose metabolism sustains 3D tumor spheroids growth regardless of nutrient environmental conditions: A multi-omics analysis
- High-pressure oxygen rewires glucose metabolism of patient-derived glioblastoma cells and fuels inflammasome response
- Delivery of a BET protein degrader via a CEACAM6-targeted antibody–drug conjugate inhibits tumour growth in pancreatic cancer models